2014 in review
Dec 30, 2014 at 11:06 am | Posted in india | Leave a commentThe WordPress.com stats helper monkeys prepared a 2014 annual report for this blog.
Here’s an excerpt:
A San Francisco cable car holds 60 people. This blog was viewed about 1,600 times in 2014. If it were a cable car, it would take about 27 trips to carry that many people.
Why do we break traffic lights? – A Quantitative Analysis
Jan 4, 2014 at 12:05 am | Posted in india | Leave a commentTags: bayesian, break, game theory, himanshu joshi, india, probability, traffic signal
India is my country and all Indians are my brothers and sisters. So this analysis believes in right to equality and assumes each of us to be equally prone to break a traffic signal. I am sure most of us would have broken a traffic signal atleast once in your lifetime or have seen someone breaking it.
Pb = Probability of breaking a traffic signal by you
Pc = Probability of getting caught when you break a signal
Pp = Probability that a policeman is standing on the traffic light to catch you
This analysis uses some basic approaches of game theory and Bayesian probability models. Please drop a comment if you have doubts in the analysis.
The Decision Tree
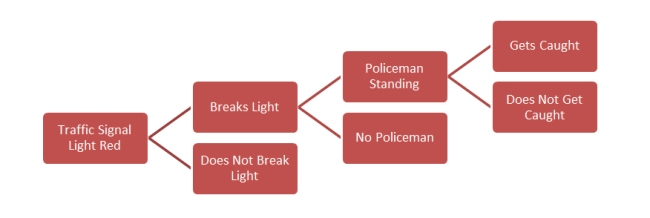
To start any analysis that involves probability, we should start with creation of the decision tree for various outcomes that can happen. If we draw a decision tree for a normal scenario:
Here we assume some more things:
- The payoffs for breaking a traffic signal are definitely more than those for not breaking a signal.
- When a rider does not break a signal, he loses some time and we can define the losses in financial terms.
- When a rider breaks a signal, he saves time thus he does not lose any money (arbitrary)
- When he gets caught, he has to pay some fine and some more extra money to the policeman to get away.
Assigning Values to Variables:
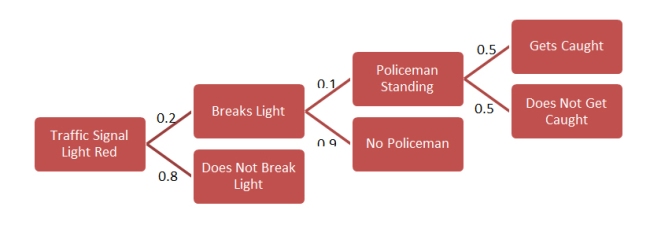
We do not know how much the loss is, in terms of money, for the rider when he does not break a signal. We assume it to be Rs. 100 to start and then proceed with our calculations. Similarly the gains that he gets by breaking the signal is equal to Rs. 100/-
Number of vehicles at any signal: 10
Number of vehicles breaking signal: 2
Number of vehicles getting caught: 1
Probability of breaking a signal, Pb : 2/10 = 0.2
Probability of getting caught, Pc: 1/2 = 0.5
Probability that a policeman stands (we can safely assume that in India, we see a policeman 1 in 10 times), Pp : 1/10 = 0.1
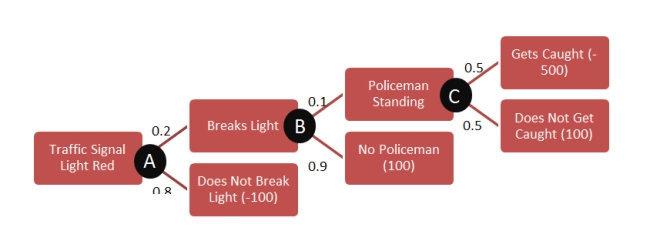
Fine when the rider is caught: Rs. 500
Updating the Decision Tree:
Next we add the payoffs / losses at various options and try to calculate the average payoffs at the various option nodes.
All we are left to is to calculate the payoffs/losses at the nodes C, B & A and try to see if breaking a signal sounds more logical.
At node C:
Nett payoff = 0.5 * 100 + 0.5 * -500 = 50 – 250 = Rs. – 200/-
At node B:
Nett payoff = 0.1 * (-200) + 0.9*100 = -20 + 90 = Rs. 70/-
At node A:
Nett payoff = 0.2 * 70 + 0.8*(-100) = 14 – 80 = Rs. -66/-
This essentially means that if there is a policeman, it is more logical for the rider not to break the rule because average expected payoff (Rs. 100 * 0.5 = Rs. 50) is less than the average expected loss (Rs. 500 * 0.5 = Rs. 250). However, if there is no policeman, the payoffs for the user to break the red light are much higher (0.9 * 100 = 90). So when there is no policeman, it sounds better to him to break the rule because he is atleast getting Rs. 90/- out of his payoff of Rs. 100/- on an average.
Overall at node A, there is only one option through which he gets a positive payoff and that is by breaking the traffic signal. So it sounds more logical to the rider to break the rule.
Next Steps:
If someone is interested in further analysing the behaviour using Game Theory of economics, he can approach the problem as under:
1. Change the payoffs and probabilities with real ones.
2. Calculate the threshold value of fine below which the rider will be tempted to break the law.
3. Calculate the optimum probability of a policeman standing on a traffic signal.
Please contact me in case you need any suggestions on game theory or Bayesian probablistic models.
Online Coupon and Deals Market in India
Oct 10, 2013 at 7:54 pm | Posted in india, inetrnet, internet | Leave a commentTags: coupon, coupon survey, coupons, deals, discounts, ecommerce, eCommerce market, guppit, india, market, online
Coupon and deals market has always been something that can not be ignored by people. People love shopping and people love deals. So how does the market scenario look in India?
The eCommerce market stands at a whooping 70000 Crore today (2013). This comes out to be slightly more than 11 billion USD. Couponing and deals market basically works over the eCommerce market and if we take 10% as a heuristic in calculating the market size for coupons, it is still a very big number.
We conducted a survey and tried to find out the penetration of coupons in India. Here are the results:
Total number of respondents: 117
Gender based distribution: Male: 87%, Female: 13%
Age Group: 30-39: 77%, 21-29: 23%
Marital Status:Married: 67%, Never Married: 32%, Separated: 2%
More than 61% of them said that they shop often online.
Convenience was the biggest factor in shopping online closely followed by discounts. Very few people shopped online for variety.
67% of the people did more than 20% of their shopping online.
90% of these respondents used a computer or laptop to make the purchase. They were not sure with the security in mobiles.
65% of the people used Google Chrome to shop online closely followed by 26% people who use Firefox.
Most of these guys search on Google and Facebook for coupons before shopping online. Only 28% of them go to any coupon website.
Only 31% of them like the way coupons are presented to them currently. They do not like the clutter through which they have to find deals.
92% of them do not want to go to any coupon site. They would love to see a service that delivers coupons right on your browser.
Thankfully Guppit.com is one such website that gives coupons to the users right on their browsers.
If you want to get more insights on this survey, you can contact me through posting a comment and I will share complete data with you.
Casteism in India – Some facts from the government database
Mar 5, 2013 at 4:12 pm | Posted in constitution, government, Independence, india | Leave a commentTags: caste, casteism, crimes, government, india, statistics
Some time back I analyzed the government database for crime against women in India. The results were surprising and insulting to our nation. Another issue that still exists in India even after 65 years of Independence is Caste-ism. So I thought of doing a similar study on the number of murders committed in the name of caste in the last decade (2001 – 2010).
Summary:
Total number of deaths
444 (44.4 deaths per year).
If we consider the population of India then this number sounds too small. However, in a modern world like today’s even 4-5 deaths per year on the grounds of caste etc. are shameful.
Top States
- Bihar – 179
- Jharkhand – 59
- Uttar Pradesh – 40
- Chhatisgarh – 35
- Madhya Pradesh – 27
That essentially means that top 5 states constitute ~77% of the total crimes in the name of caste. It is to be noticed that the five states are adjoining and similar communities live in the states. The people are hindi speaking, traditional, high level of believers and god fearing.
Most of the movies that are made around caste system show the protagonist to be based out of these states.
Complete list of all the states is as under:
No data is available from the north-eastern states. This can indicate either a perfect collaborative environment in which people from all the castes live, or a lack of data in the states.
Surprisingly Haryana and Uttarakhand show a zero figure. This is something I am unable to understand because of the reports of other types of crimes from these states.
Of the four southern states, only Kerala reports a zero figure. Probably some regression has to be done with overall education levels in a state vs. such crimes. I will do that and will post soon.
I am also surprised to see J&K in the list. They have other problems to solve rather than such issues.
This is it for now. My next step is to draw parallels between education and different kinds of crimes. Am hopeful that I will be able to find some correlation between education and such crimes that requires a narrow mindset which can be broadened by better and improved education.
Thanks for reading this post till the time.
Crime Against Women in India
Dec 19, 2012 at 1:52 pm | Posted in india | 3 CommentsTags: analysis, correlation, crime, crime against women, india, number of cases, rape, report, study
यत्र नार्यस्तु पूज्यन्ते, रमन्ते तत्र देवता
यत्र नार्यस्तु ना पूज्यन्ते तत्र सर्व क्रिया विफ़ल: ।
This is an old saying in Sanskrit meaning “Places where woman is worshiped there the Gods delighted. Where Woman is not worshiped, there good deeds are without fruit!”
“Ten times more worthy of worship than the Father is the Guru, but a thousand times more worthy than the Guru is the Mother!”
I have drawn these adages, proverbs, sayings and whatever you want to call them from the Indian history. How do they apply to the present?
To understand more about crimes against Women in India, I did some thorough research on the internet – visited government databases, read news articles, read articles on various websites. Being an engineer, I cannot live without numbers and so calculated various numbers as well. Here is a summary of my analysis:
The growth rate of crime against women in India is more than the growth rate of Indian population itself. Such crimes were not reported to the police earlier because of social stigma but the number of cases reported has dramatically increased in the past few years. This can imply two things
1. Either the society has opened up towards taking help from the judiciary system and punishing the culprits or
2. The percentage of cases reported remain the same, however total number of cases have increased manifolds.
There is no answer to which of the assumption stated above is correct, but I personally wish that the second one is not true.
Crime against Women can be categorized under the following heads:
1. Domestic Violence
The incidents of domestive violence are higher among the lower Socio-Economic Classes (SECs). The Protection of Women from Domestic Violence Act, 2005 came into force on October 26, 2006.
2. Female infanticides and sex selective abortions
India has a high Male / Female ratio and the main reason contributing to it is the killing of female child long before they open their eyes to this world. A surprising but true fact is that tribes in India have better Male/Female ratio as compared to well developed urban societies. Dowry can be attributed to as the main reason for female infanticide. Dowry is still prevalent in most parts of India. To counter this problem, all medical tests that can be used to determine the sex of the child have been banned in India.
3. Child Marriage
According to UNICEF’s “State of the World’s Children-2009” report, 47% of India’s women aged 20–24 were married before the legal age of 18, with 56% in rural areas. The report also says that 40% of the total child marriages in the World happen in India.
4. Dowry
A 1997 report claimed that at least 5,000 women die each year because of dowry deaths, and at least a dozen die each day in ‘kitchen fires’ thought to be intentional. In 1985, the Dowry Prohibition (maintenance of lists of presents to the bride and bridegroom) rules were framed. According to these rules, a signed list of presents given at the time of the marriage to the bride and the bridegroom should be maintained. The list should contain a brief description of each present, its approximate value, the name of whoever has given the present and his/her relationship to the person.
5. Sexual Harassment & Rape
Eve teasing is a euphemism used for sexual harassment or molestation of women by men. Many activists blame the rising incidents of sexual harassment against women on the influence of “Western culture”. In 1987, The Indecent Representation of Women (Prohibition) Act was passed to prohibit indecent representation of women through advertisements or in publications, writings, paintings, figures or in any other manner.
In order to analyze rapes in India, I downloaded data from the government’s National Crime Record Bureau and did some analysis on my own. Here is the summary.
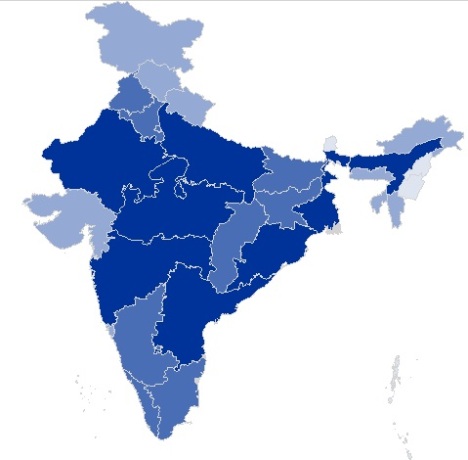
Rape Map of India (Darker = More number of Rape Cases)
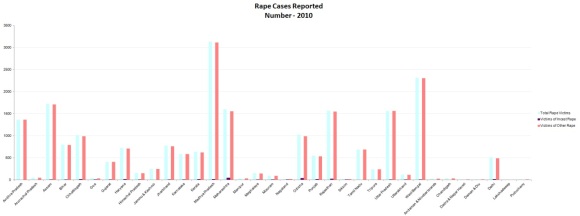
In terms of Total Number of Rapes Reported (click on the image for better viewing):
The number of cases alone in Madhya Pradesh are more than double of those in Uttar Pradesh. Surprisingly West Bengal has the second most number of reported rape cases. Compare the size of Karnataka and Delhi and the number of rape cases in the two states.
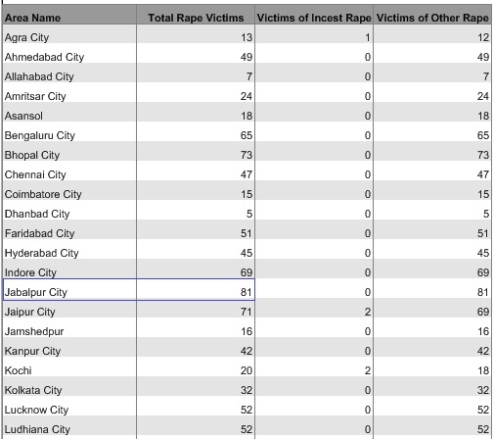
Some major high-sensitivity cities in India were studies and the report was surprising:
Mumbai reported 201 cases of rape, Bangalore 65, Kolkata 32, Pune 91, Chennai 47 and Delhi 414.
However the most surprising of them all was the following result:
Tier 2 cities in Madhya Pradesh (Bhopal, Indore and Jabalpur) show large number of reported cases.
Jabalpur reports 1:13016 (Rape Cases:Population), which is the highest in any city in India. Similarly Kolkata reports 1:140209 which is the lowest in any city in India. So what can be inferred from this data is that even though Kolkata reports less number of reported cases, the cases in other areas of West Bengal are high and that can be attributed to low education levels.
Total number of reported cases in Delhi is more than double in Mumbai. Delhi comes third in the list of cities prone to rape. The sequence goes like this:
1. Jabalpur (1:13016)
2. Bhopal (1:24598)
3. Delhi (1:26589)
Ahmedabad (1:113685), Bangalore (1:129630) & Kolkata (1:140209) remains the safest cities in India.
I am not deducing anything out of the data at the moment but I would love to find out a detailed correlation between education levels and such incidences.
Feel free to comment on this post and use this data wherever you want to use it.
मज़ा लिया जाए – Ghazal
Dec 12, 2012 at 11:42 am | Posted in india | Leave a commentTags: bazm, ghazal, himanshu joshi, hindi, india, kavita, mushaayara, nazm, poetry, urdu
दिन है इतवार का मज़ा लिया जाए
थोडा इंतज़ार का मज़ा लिया जाए
जवानी का पतझड़ कब का गुज़र गया गया
बुढापे की बहार बहार का मज़ा लिया जाए
कलम दवात मेरी पूरी ज़िन्दगी को खा गए
खंजरों की धार का मज़ा लिया जाए
बेईमान हो गए तो उनकी हैसियत बदल गई
फिर से इमानदार का मज़ा लिया जाए
पहली नज़र में ही उसे दिल दिया मैंने
मोहब्बत की इस हार का मज़ा लिया जाए
कभी कभी बच्चे भी बनके देख लो यारों
माँ के उस दुलार का मज़ा लिया जाए
घटनाएं रोज़ ही होती रहेंगी नया कुछ नहीं है
चलो पुराने अखबार का मज़ा लिया जाए
Hindi ki Kahaani
Sep 14, 2012 at 12:48 pm | Posted in india | Leave a commentTags: hindi, hindi poetry, india, kataaksh, kavita, poem, poetry, sattire
युग बदल गया अब वो हिंदी न रही
सलवार की जगह जींस आ गयी, और माथे पे बिंदी न रही |
कल तक जो दुपट्टा था आज वो stole हो गया
अरे हिंदी का आसन बुरी तरह से डांवाडोल हो गया |
हिंदी बोलने में आजकल के संस्कारी युवा झिझकते हैं, शर्माते हैं
अधकचरा अंग्रेजी बोल कर अपने जैसे ही लोगों में upclass कहलाते हैं |
हिंदी की इज्ज़त सिर्फ सितम्बर के राजभाषा मास में होती है
बाकी के महीने ये किसी कोने में दुबक कर सोती है |
अगर आगे बढ़ना है तो हमें इसे ऊपर उठाना होगा
हिंदी की आग को हम सबके अन्दर भड़काना होगा
वरना मेरे दोस्त, अधकचरी भाषाओँ में हम कहीं खो जायेंगे
जिन संस्कारों को दुनिया मानती है उनमे भी हम अधकचरे हो जायेंगे |
What my English teachers taught me :)
Jun 18, 2012 at 10:13 pm | Posted in fun, humour, india, knowledge | Leave a commentTags: english, english teacher, funny, hum, humor, india, jokes, teacher
Ha Ha ha..
Unknown Medical Facts
Jun 9, 2012 at 3:57 pm | Posted in india | Leave a commentTags: doctor, funny, humor, india, laughter, medical facts, photo, unknown facts

Physics or Nothing
Jun 8, 2012 at 12:27 am | Posted in fun, humour, india, knowledge | Leave a commentTags: fun, humour, physics, rutherford, stamp, stamp collecting
Blog at WordPress.com.
Entries and Comments feeds.

